Azure OpenAI Service – How To Get Insights By Collecting Logging Data

Azure OpenAI Service – How To Get Insights By Collecting Logging Data

This is part of my series on GenAI Services in Azure:

  1. Azure OpenAI Service – Infra and Security Stuff
  2. Azure OpenAI Service – Authentication
  3. Azure OpenAI Service – Authorization
  4. Azure OpenAI Service – Logging
  5. Azure OpenAI Service – Azure API Management and Entra ID
  6. Azure OpenAI Service – Granular Chargebacks
  7. Azure OpenAI Service – Load Balancing
  8. Azure OpenAI Service – Blocking API Key Access
  9. Azure OpenAI Service – Securing Azure OpenAI Studio
  10. Azure OpenAI Service – Challenge of Logging Streaming ChatCompletions
  11. Azure OpenAI Service – How To Get Insights By Collecting Logging Data
  12. Azure OpenAI Service – How To Handle Rate Limiting
  13. Azure OpenAI Service – Tracking Token Usage with APIM
  14. Azure AI Studio – Chat Playground and APIM
  15. Azure OpenAI Service – Streaming ChatCompletions and Token Consumption Tracking
  16. Azure OpenAI Service – Load Testing

Hello geeks! Yes, I’m back with yet another post on the Azure OpenAI Service. There always seems to be more cool stuff to talk about with this service that isn’t specific to the models themselves. If you follow this blog, you know I’ve spent the past year examining the operational and security aspects of the service. Through trial and error and a ton of discussions with S500 customers across all industries, I’ve learned a ton and my goal has to be share back those lessons learned with the wider community. Today I bring you more nuggets of useful information.

Like any good technology nerd, I’m really nosey. Over the years I’ve learned about all the interesting information web-based services return the response headers and how useful this information can be to centrally capture and correlate to other pieces of logging information. These headers could include things like latency, throttling information, or even usage information that can be used to correlate the costs of your usage of the service. While I had glanced at the response headers from the Azure OpenAI Service when I was doing my work on the granular chargeback and streaming ChatCompletions posts, I hadn’t gone through the headers meticulously. Recently, I was beefing up Shaun Callighan’s excellent logging helper solution with some additional functionality I looked more deeply at the headers and found some cool stuff that was worth sharing.

How to look at the headers (skip if you don’t want to nerd out a bit)

My first go to whenever examining a web service is to power up Fiddler and drop it in between my session and the web service. While this works great on a Windows or MacOS box when you can lazily drop the Fiddler-generated root CA (certificate authority) into whatever certificate store your browser is using to draw its trusted CAs from, it’s a bit more work when conversing with a web service through something like Python. Most SDKs in my experience use the requests module under the hood. In that case it’s a simple matter of passing a kwarg some variant of the option to disable certificate verification in the requests module (usually something like verify=false) like seen below in the azure.identity SDK.

from azure.identity import DefaultAzureCredential, get_bearer_token_provider

try:
    token_provider = get_bearer_token_provider(
        DefaultAzureCredential(
            connection_verify=False
        ),
        "https://cognitiveservices.azure.com/.default",
    )
except:
    logging.error('Failed to obtain access token: ', exc_info=True)

Interestingly, the Python openai SDK does not allow for this. Certificate verification cannot be disabled with an override. Great security control from the SDK developers, but no thought of us lazy folks. The openai SDK uses httpx under the hood, so I took the nuclear option and disabled verification of certificates in the module itself. Obviously a dumb way of doing it, but hey lazy people gotta lazy. If you want to use Fiddler, be smarter than me and use one of the methods outlined in this post to trust the root CA generated by Fiddler.

All this to get the headers? Well, because I like you, I’m going to show you a far easier way to look at these headers using the native openai SDK.

The openai SDK doesn’t give you back the headers by default. Instead the response body is parsed neatly for you and a new object is returned. Thankfully, the developers of the library put in a way to get the raw response object back which includes the headers. Instead of using the method chat.completions.create you can use chat.completions.with_raw_response.create. Glancing at the SDK, it seems like all methods supported by both the native client and AzureOpenAI client support the with_raw_response method.

def get_raw_chat_completion(client, deployment_name, message):
    response = client.chat.completions.with_raw_response.create(
    model=deployment_name,
    messages= [
        {"role":"user",
         "content": message}
    ],
    max_tokens=1000,
    )

    return response

Using this alternative method will save you from having to mess with the trusted certificates as long as you’re good with working with a text-based output like the below.

Headers({'date': 'Fri, 17 May 2024 13:18:21 GMT', 'content-type': 'application/json', 'content-length': '2775', 'connection': 'keep-alive', 'cache-control': 'no
-cache, must-revalidate', 'access-control-allow-origin': '*', 'apim-request-id': '01e06cdc-0418-47c9-9864-c914979e9766', 'strict-transport-security': 'max-age=3
1536000; includeSubDomains; preload', 'x-content-type-options': 'nosniff', 'x-ms-region': 'East US', 'x-ratelimit-remaining-requests': '1', 'x-ratelimit-remaini
ng-tokens': '1000', 'x-ms-rai-invoked': 'true', 'x-request-id': '6939d17e-14b2-44b7-82f4-e751f7bb9f8d', 'x-ms-client-request-id': 'Not-Set', 'azureml-model-sess
ion': 'turbo-0301-57d7036d'})

This can be incredibly useful if you’re dropped some type of gateway, such as an APIM (API Management) instance in front of the OpenAI instance for load balancing, authorization, logging, throttling etc. If you’re using APIM, you can my buddy Shaun’s excellent APIM Policy Snippet to troubleshoot a failing APIM policy. Now that I’ve given you a workaround to using Fiddler, I’m going to use Fiddler to explore these headers for the rest of the post because I’m lazy and I like a pretty GUI sometimes.

Examining the response headers and correlating data to diagnostic logs

Here we can see the response headers returned from a direct call to the Azure OpenAI Service.

The headers which should be of interest to you are the x-ms-region, x-ratelimit-remaining-requests, x-ratelimit-remaining-tokens, and x-request-id. The x-ms-region is the region where the Azure OpenAI instance you called is located (I’ll explain why this can be useful in a bit). The x-ratelimit headers tell you how close you are to hitting rate limits on a specific instance of a model in an AOAI instance. This is where load balancing and provisioned throughput units can help mitigate the risk of throttling. The load balancing headers are still important to your application devs to pay attention to and account for even if you’re load balancing across multiple instances because load balancing mitigates but doesn’t eliminate the risk of throttling. The final interesting header is the apim-request-id which is the unique identifier of this specific request to the AOAI service. If you’re wondering, yes it looks like the product group has placed the compute running the models behind an instance of Azure API Management.

Let’s first start with the apim-request-id response header. This header is useful because it can be used to correlate a specific request it’s relevant entry in the native diagnostic logging for the Azure OpenAI Service. While I’ve covered the limited use of the diagnostic logging within the service, there are some good nuggets in there which I’ll cover now.

Using the apim-request-id, I can make a query to wherever I’m storing the diagnostic logs for the AOAI instance to pull the record for the specific request. In my example I’m using a Log Analytics Workspace. Below you can see my Kusto query which pulls the relevant record from the RequestResponse category of logs.

Correlating a request to the Azure OpenAI Service to the diagnostic logs

There are a few useful pieces of information in this log entry.

  • DurationMs – This field tells us how long the response took from the Azure OpenAI Service. My favorite use of this field comes when considering non-PTU-based Azure OpenAI instances. Lots of people want to use the service and the underlining models in a standard pay-as-you-go tier can get busy in certain regions at certain times. If you combine this information with the x-ms-region response header you can begin to build a picture of average response times per region at specific times of the day. If you’re load balancing, you can tweak your logic to direct your organization’s prompts to the region that has the lowest response time. Cool right?
  • properties_s.streamType – This field tells you whether or not the request was a streaming-type completion. This can be helpful to give you an idea of how heavily used streaming is in your org. As I’ve covered previously, capturing streaming prompts and completions and calculating token usage can a challenge. This property can help give you an idea how heavily used it is across your org which may drive you to get a solution in place to do that calculation sooner rather than later.
  • properties_s.modelName, modelVersion – More useful information to enrich the full picture of the service usage while being able to trace that information back to specific prompts and responses.
  • objectId – If your developers are using Entra ID-based identities to authenticate to the AOAI service (which you should be doing and avoiding use of API keys where possible), you’ll have the objectid of the specific service principal that made the request.

Awesome things you can do with this information

You are likely beginning to see the value of collecting the response headers, prompt and completions from the request and respond body, and enriching that information from logging data collected from diagnostics logs. With that information you can begin getting a full picture of how the service is being used across your organization.

Examples include:

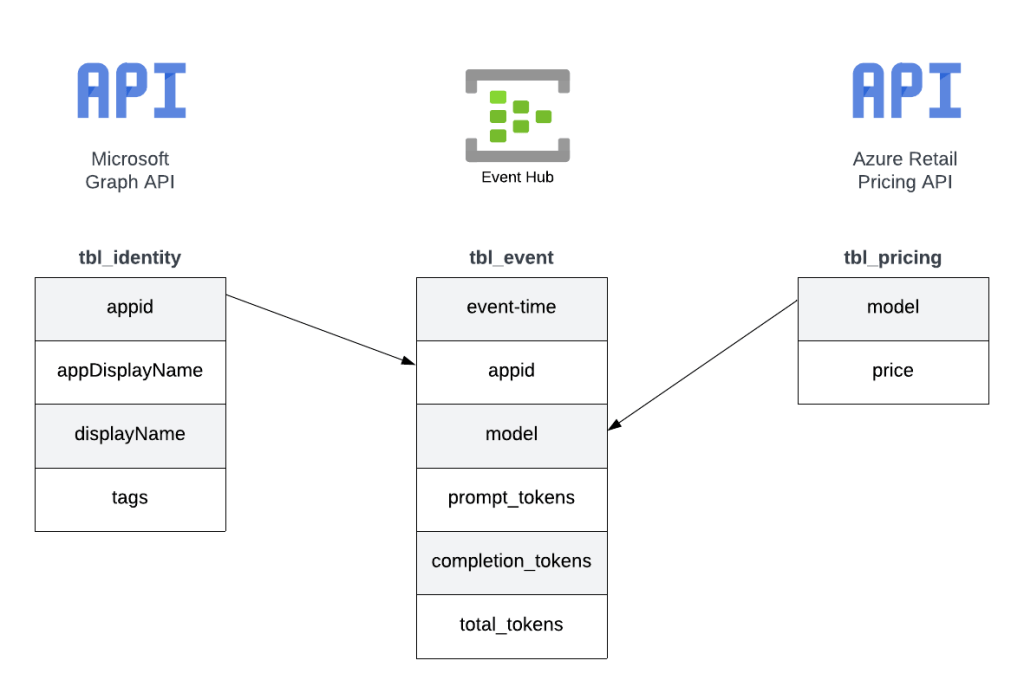
  • Calculating token usage for organizational chargebacks
  • Optimizing the way you load balance to take advantage of less-used regions for faster response times
  • Making troubleshooting easier by being able to trace a specific response back to which instance it, the latency, and the prompt and completion returned by the API.

There are a ton of amazing things you can do with this data.

How the hell do you centrally collect and visualize this data?

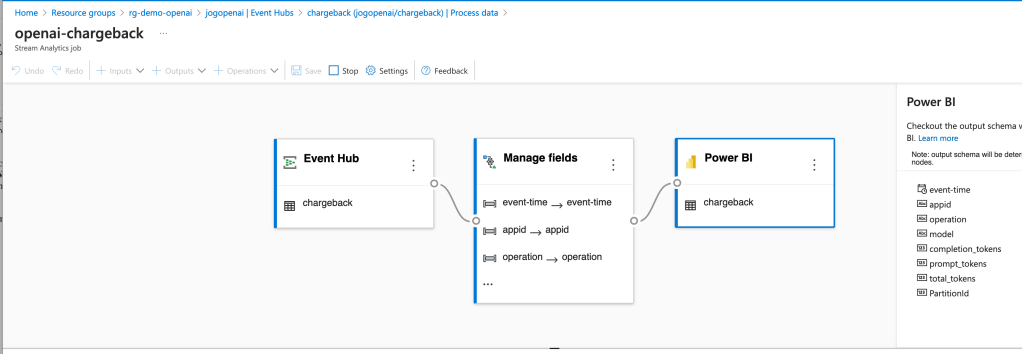
Your first step should be to centrally capturing this data. You can use the APIM pattern that is quite popular or you can build your own solution (I like to refer to this middle tier component as a “Generative AI Gateway”. $50 says that’s the new buzzwords soon enough). Either way, you want this data captured and delivered somewhere. In my demo environment I deliver the data to an Event Hub, do a bit of transformation and dump it into a CosmosDB with Stream Analytics, and the visualize it with PowerBI. An example of the flow I use in my environment is below.

Example flow of how to capture and monetize operational and security data from your Azure OpenAI Usage

The possibilities for the architecture are plentiful, but the value of this data to operations, security, and finance is worth the effort to assemble something in your environment. I hope this post helped to get your more curious about what your usage looks like and how could use this data to optimize operationally, financially, and even throw in a bit more security with more insight into what your users are doing with this GenAI models by reviewing the captured prompts and responses. While there isn’t a lot of regulation around the use of GenAI yet, it’s coming and by capturing this information you’ll be ready to tackle it.

Thanks for reading!

Load Balancing in Azure OpenAI Service

Load Balancing in Azure OpenAI Service

This is part of my series on GenAI Services in Azure:

  1. Azure OpenAI Service – Infra and Security Stuff
  2. Azure OpenAI Service – Authentication
  3. Azure OpenAI Service – Authorization
  4. Azure OpenAI Service – Logging
  5. Azure OpenAI Service – Azure API Management and Entra ID
  6. Azure OpenAI Service – Granular Chargebacks
  7. Azure OpenAI Service – Load Balancing
  8. Azure OpenAI Service – Blocking API Key Access
  9. Azure OpenAI Service – Securing Azure OpenAI Studio
  10. Azure OpenAI Service – Challenge of Logging Streaming ChatCompletions
  11. Azure OpenAI Service – How To Get Insights By Collecting Logging Data
  12. Azure OpenAI Service – How To Handle Rate Limiting
  13. Azure OpenAI Service – Tracking Token Usage with APIM
  14. Azure AI Studio – Chat Playground and APIM
  15. Azure OpenAI Service – Streaming ChatCompletions and Token Consumption Tracking
  16. Azure OpenAI Service – Load Testing

Updates:

5/23/2024 – Check out my new post on this topic here!

Another Azure OpenAI Service post? Why not? I gotta justify the costs of maintaining the blog somehow!

The demand for the AOAI (Azure OpenAI Service) is absolutely insane. I don’t think I can compare the customer excitement over the service to any other service I’ve seen launch during my time working at cloud providers. With that demand comes the challenge to the cloud service provider of ensuring there is availability of the service for all the customers that want it. In order to do that, Microsoft has placed limits on the number of tokens/minute and requests/minute that can be made to a specific AOAI instance. Many customers are hitting these limits when moving into production. While there is a path for the customer to get the limits raised by putting in a request to their Microsoft account team, this process can take time and there is no guarantee the request can or will be fulfilled.

What can customers do to work around this problem? You need to spin up more AOAI instances. At the time of this writing you can create 3 instances per region per subscription. Creating more instances introduces the new problem distributing traffic across those AOAI instances. There are a few ways you could do this including having the developer code the logic into their application (yuck) ore providing the developer a singular endpoint which is doing the load balancing behind the scenes. The latter solution is where you want to live. Thankfully, this can be done really easily with a piece of Azure infrastructure you are likely already using with AOAI. That piece of infrastructure is APIM (Azure API Management).

Sample AOAI Architecture

As I’ve covered in my posts on AOAI and APIM and my granular chargebacks in AOAI, APIM provides a ton of value the AOIA pattern by providing a gate between the application and the AOAI instance to inspect and action on the request and response. It can be used to enforced Azure AD authentication, provide enhanced security logging, and capture information needed for internal chargebacks. Each of these enhancements is provided through APIM’s custom policy language.

APIM and AOAI Flow

By placing APIM into the mix and using a simple APIM policy we can introduce simple randomized load balancing. Let’s take a deeper look at this policy

<!-- This policy randomly routes (load balances) to one of the two backends -->
<!-- Backend URLs are assumed to be stored in backend-url-1 and backend-url-2 named values (fka properties), but can be provided inline as well -->
<policies>
    <inbound>
        <base />
        <set-variable name="urlId" value="@(new Random(context.RequestId.GetHashCode()).Next(1, 3))" />
        <choose>
            <when condition="@(context.Variables.GetValueOrDefault<int>("urlId") == 1)">
                <set-backend-service base-url="{{backend-url-1}}" />
            </when>
            <when condition="@(context.Variables.GetValueOrDefault<int>("urlId") == 2)">
                <set-backend-service base-url="{{backend-url-2}}" />
            </when>
            <otherwise>
                <!-- Should never happen, but you never know ;) -->
                <return-response>
                    <set-status code="500" reason="InternalServerError" />
                    <set-header name="Microsoft-Azure-Api-Management-Correlation-Id" exists-action="override">
                        <value>@{return Guid.NewGuid().ToString();}</value>
                    </set-header>
                    <set-body>A gateway-related error occurred while processing the request.</set-body>
                </return-response>
            </otherwise>
        </choose>
    </inbound>
    <backend>
        <base />
    </backend>
    <outbound>
        <base />
    </outbound>
    <on-error>
        <base />
    </on-error>
</policies>

In the policy above a random number is generated that is greater than or equal to 1 and less than 3 using the Next method. The application’s request is sent along to one of the two backends based upon that number. You could add additional backends by upping the max value in the Next method and adding another when condition. Pretty awesome right?

Before you ask, no you do not need a health probe to monitor a cloud service provider managed service. Please don’t make your life difficult by introducing an Application Gateway behind the APIM instance in front of the AOAI instance because Application Gateway allows for health probes and more complex load balancing. All you’re doing is paying Microsoft more money, making your operations’ team life miserable, and adding more latency. Ensuring the service is available and health is on the cloud service provider, not you.

But Matt, what about taking an AOAI instance out of the pool if it beings throttling traffic? Again, no you do not need to this. Eventually this APIM as a simple load balancer pattern will not necessary when the AOAI service is more mature. When that happens, your applications consuming the service will need to be built to handle throttling. Developers are familiar with handling throttling in their application code. Make that their responsibility.

Well folks, that’s this short and sweet post. Let’s summarize what we learned:

  • This pattern requires Azure AD authentication to AOAI. API keys will not work because each AOAI instance has different API keys.
  • You may hit the requests/minute and tokens/minute limits of an AOAI instance.
  • You can request higher limits but the request takes time to be approved.
  • You can create multiple instances of AOAI to get around the limits within a specific instance.
  • APIM can provide simple randomized load balancing across multiple instances of AOAI.
  • You DO NOT need anything more complicated than simple randomized load balancing. This is a temporary solution that you will eventually phase out. Don’t make it more complicated than it needs to be.
  • DO NOT introduce an Application Gateway behind APIM unless you like paying Microsoft more money.

Have a great week!

Granular Chargebacks in Azure OpenAI Service

Granular Chargebacks in Azure OpenAI Service

This is part of my series on GenAI Services in Azure:

  1. Azure OpenAI Service – Infra and Security Stuff
  2. Azure OpenAI Service – Authentication
  3. Azure OpenAI Service – Authorization
  4. Azure OpenAI Service – Logging
  5. Azure OpenAI Service – Azure API Management and Entra ID
  6. Azure OpenAI Service – Granular Chargebacks
  7. Azure OpenAI Service – Load Balancing
  8. Azure OpenAI Service – Blocking API Key Access
  9. Azure OpenAI Service – Securing Azure OpenAI Studio
  10. Azure OpenAI Service – Challenge of Logging Streaming ChatCompletions
  11. Azure OpenAI Service – How To Get Insights By Collecting Logging Data
  12. Azure OpenAI Service – How To Handle Rate Limiting
  13. Azure OpenAI Service – Tracking Token Usage with APIM
  14. Azure AI Studio – Chat Playground and APIM
  15. Azure OpenAI Service – Streaming ChatCompletions and Token Consumption Tracking
  16. Azure OpenAI Service – Load Testing

Updates:

Yes folks, it’s time for yet another Azure OpenAI Service post. This time around I’m going to cover a pattern that can help with operationalizing the service by collecting and analyzing logging data for proper internal chargebacks to the many business units you likely have requesting the service. You’ll want to put on your nerd hat today because we’re going to need to dive a bit in the weeds for this one.

Let me first address why this post is even necessary. The capabilities provided by the AOAI (Azure OpenAI Service) have the feel of a core foundational technology, almost feeling as necessary as basic networking and PKI (public key infrastructure). The service has usages in almost every portion of the business and, very likely, every business unit is asking you for AI at this point.

Beyond the business demand, the architecture of the Azure OpenAI Service lends itself well to being centralized. Each instance offers the same set of static models and the data sent to and returned from the models is ephemeral. Unless you are creating fine-tuned models (which should be a very small percentage of customers), there isn’t any data stored by the service. Yes, there is default storage and human review of prompts and completions for abuse, but customers can opt out of this process. Additionally, as of the date of this blog, customers do not have access to those stored prompts and completions anyway so the risk of one compromise of those 30-days of stored prompts and completions due to a failed customer control doesn’t exist. Don’t get me wrong, there are legitimate reasons to create business unit specific instances for the service for edge use cases such as the creation of fine-tuned models. There are also good arguments to be made to create specific instances for compliance boundaries and separating production from non-production. However, you should be looking at consolidating instances where possible and providing it as a centralized core service.

Now if you go down the route I suggested above, you’ll run into a few challenges. Two of most significant challenges are throttling limits per instance and chargebacks. Addressing the throttling problem isn’t terribly difficult if you’re using the APIM (Azure API Management) pattern I mentioned in my last post. You can enforce specific limits on a per application basis when using Azure AD authentication at APIM on the frontend and you can use a very basic round robin-like load balancing APIM policy at the backend to scale across multiple Azure OpenAI Service instances. The chargeback problem is a bit more difficult to solve and that’s what I’ll be covering in the rest of the post.

The AOAI Service uses a consumption model for pricing which means the more you consume, the more you pay. If you opt to centralize the service, you’re going to need a way to know which app is consuming which amount of tokens. As I covered in my logging post, the native logging capabilities of the AOAI service are lacking as of the date of this blog post. The logs don’t include details as to who made a call (beyond an obfuscated IP address) or the number of tokens consumed by a specific call. Without this information you won’t be able to determine chargebacks. You should incorporate some of this logging directly into the application calling the AOAI service, but that logging will likely be application centric where the intention is to trace a specific call back to an individual user. For a centralized service, you’re likely more interested in handling chargebacks at the enterprise level and want to be able to associate specific token consumption back to a specific business unit’s application.

I took some time this week and thought about how this might be able to be done. The architecture below is what I came up with:

Azure OpenAI Service Chargeback Architecture

APIM and APIM custom policies are the key components of this architecture that make chargebacks possible. It is used to accomplish two goals:

  1. Enforce Azure AD Authentication and Authorization to the AOAI endpoint.
  2. Provide detailed logging of the request and response sent to the service.

Enforcing Azure AD authentication and authorization gives me the calling application’s service principal or managed identity identifier which allows me to correlate the application back to a specific business unit. If you want the details on that piece you can check out my last post. I’ve also pushed the custom APIM policy snippet to GitHub if you’d like to try it yourself.

The second goal is again accomplished through a custom APIM policy. Since APIM sits in the middle of the conversation it gets access to both the request from the application to the AOAI service and the response back. Within the response from a Completion or ChatCompletion the API returns the number of prompt, completion, and total tokens consumed by a specific request as can be seen below.

{
  "choices": [
    {
      "finish_reason": "stop",
      "index": 0,
      "message": {
        "content": "This is a test message.",
        "role": "assistant"
      }
    }
  ],
  "created": 1684425128,
  "id": "chatcmpl-7HaDAS0JUZKcAt2ch2GC2tOJhrG2Q",
  "model": "gpt-35-turbo",
  "object": "chat.completion",
  "usage": {
    "completion_tokens": 6,
    "prompt_tokens": 14,
    "total_tokens": 20
  }
}

Awesome, the information we need is there but how do we log it? For that, you can use an APIM Logger. An APIM Logger is an integration with a specific instance of Azure Application Insights or Azure Event Hub. The integration allows you to specify the logger in an APIM policy and send specific data to that integrated service. For the purposes of this integration I choose the Azure Event Hub. The reason being I wanted to allow logging large events (the integration supports up to 200KB messages) in case I wanted to capture the prompt or completion and I wanted the flexibility to integrate with an upstream service for ETL (extract, transform, load).

Setting the up the logger isn’t super intuitive if you want to use a managed identity for APIM to authenticate to the Azure Event Hub. Once the logger is created, you can begin calling it in the APIM policy. Below is an example of the APIM policy I used to parse the request and response and extract the information I was interested in.

        <log-to-eventhub logger-id="chargeback" partition-id="1">@{
                var responseBody = context.Response.Body?.As<JObject>(true);
                return new JObject(
                    new JProperty("event-time", DateTime.UtcNow.ToString()),
                    new JProperty("appid", context.Request.Headers.GetValueOrDefault("Authorization",string.Empty).Split(' ').Last().AsJwt().Claims.GetValueOrDefault("appid", string.Empty)),
                    new JProperty("operation", responseBody["object"].ToString()),
                    new JProperty("model", responseBody["model"].ToString()),
                    new JProperty("modeltime", context.Response.Headers.GetValueOrDefault("Openai-Processing-Ms",string.Empty)),
                    new JProperty("completion_tokens", responseBody["usage"]["completion_tokens"].ToString()),
                    new JProperty("prompt_tokens", responseBody["usage"]["prompt_tokens"].ToString()),
                    new JProperty("total_tokens", responseBody["usage"]["total_tokens"].ToString())
                ).ToString();
        }</log-to-eventhub>

In the policy above I’m extracting the application’s client id from the access token generated by Azure Active Directory for access to the Azure OpenAI Service. Recall that I have the other policy snippet in place I mentioned earlier in this post in place to force the application to authenticate and authorize using Azure AD. I then grab the pieces of information from the response that I would find useful in understanding the costs of the service and each app’s behavior within the AOAI service.

Now that the logs are being streamed to the Event Hub, you need something to pick them up. You have a lot of options in this space. You could use Azure Data Factory, custom function, Logic App, SIEM like Splunk, and many others. What you choose to do here really depends on where you want to put the data and what you want to do with it prior to putting it there. To keep it simple for this proof-of-concept, I chose the built-in Azure Stream Analytics integration with Event Hub.

The integration creates a Stream Analytics Job that connects to the Event Hub, does small amount of transformation in setting the types for specific fields, and loads the data into a PowerBI dataset.

Azure Stream Analytics and Event Hub Integration

Once the integration was setup, the requests and responses I was making to the AOAI services began to populate in the Power BI dataset. I was then able to build some really basic (and very ugly) visuals to demonstrate the insights this pattern provides for chargebacks. Each graphic shows the costs accumulated by individual applications by their application id.

Power BI Report Showing Application by Application Costs

Pretty cool right? Simple, easy to implement, and decent information to work from.

Since this was a POC, I cut some corners on the reporting piece. For example, I hardcoded the model pricing into some custom columns. If I were to do this at the enterprise level, I’d be supplementing this information from data pulled from the Microsoft Graph and the Azure Retail Pricing REST API. From the Microsoft Graph I’d pull additional attributes about the service principal / managed identity such as a more human readable name. From the Azure Retail Pricing REST API I’d pull down the most recent prices on a per model basis. I’d also likely store this data inside something like Cosmos or Azure SQL to provide for more functionality. From a data model perspective, I’d envision a “enterprise-ready” data model version of the pattern looking like the below.

Possible data model

The key challenge I set out to address here was how to get the data necessary to do chargebacks and what could I do with that data once I got it. Mission accomplished!

Well folks, that covers it. I’d love to see someone looking for a side project with more data skills than me (likely any human being breathing air today) build out the more “full featured” solution using a similar data model to what I referenced above. I hope this pattern helps point your organization in the right direction and spurs some ideas as to how you could solve the ETL and analysis part within your implementation of this pattern.

I’m always interested in hearing about cool solutions. If you come up with something neat, please let me know in the comments or each out on LinkedIn.

Have a great week!