This is part of my series on Network Security Perimeters:
- Network Security Perimeters – The Problem They Solve
- Network Security Perimeters – NSP Components
- Network Security Perimeters – NSPs in Action – Key Vault Example
- Network Security Perimeters – NSPs in Action – AI Workload Example
- Network Security Perimeters – NSPs for Troubleshooting
UPDATE 2/23/2026 – NSP support for Microsoft Foundry resources is generally available!
Hello again! Today I’ll be covering another NSP (Network Security Perimeters) use case, this time focused on AI (gotta drive traffic, am I right?). This will be the fourth entry in my NSP series. If you haven’t read at least the first and second post, you’ll want to do that before jumping into this one because, unlike my essays back in college, I won’t be padding the page count by repeating myself. Let’s get to it!
Use Case Background
Over the past year I’ve worked with peers helping a number of customers get a quick and simple RAG (retrieval augmented generation) workload into PoC (proof-of-concept). The goal of these PoCs were often to validate that the LLMs (large language models) could provide some level of business value when supplementing them with corporate data through a RAG-based pattern. Common use cases included things like building a chatbot for support staff which was supplemented with support’s KB (knowledge base) or chatbot for a company’s GRC (governance risk and compliance) team which was supplemented with corporate security policies and controls. You get the gist of it.

In the Azure realm this pattern is often accomplished using three core services. These services include the Azure OpenAI Service (now more typically AI Foundry), AI Search, and Azure Storage. In this pattern AI Search acts as the as the search index and optional vector database, Azure Storage stores the data in blob storage before it’s chunked and placed inside AI Search, and Azure OpenAI or AI Foundry hosts the LLM. Usage of this pattern requires the data be chunked (think chopped up into smaller parts before it’s stored as a record in a database while still maintaining the important context of the data). There are many options for chunking which are far beyond the scope of this post (and can be better explained by much smarter people), but in Azure there are three services (that I’m aware of anyway) that can help with chunking vs doing it manually. These include:
- Azure AI Document Intelligence’s layout model and chunking features
- Azure OpenAI / AI Foundry’s chat with your data
- Azure AI Search’s skillsets and built-in vectorization
Of these three options, the most simple (and point and click) options are options 2 and 3. Since many of these customers had limited Azure experience and very limited time, these options tended to serve for initial PoCs that then graduated to more complex chunking strategies such as the use of option 1.
The customer base that was asking for these PoCs fell into one or more of the these categories:
- Limited staff, resources, and time
- Limited Azure knowledge
- Limited Azure presence (no hybrid connectivity, no DNS infrastructure setup for support of Private Endpoints
All of these customers had minimum set of security requirements that included basic network security controls.
RAG prior to NSPs
While there are a few different ways to plumb these services together, these PoCs would typically have the services establish network flows as pictured below. There are variations to this pattern where the consumer may be going through some basic ChatBot app, but in many cases consumers would interact direct with the Azure OpenAI / AI Foundry Chat Playground (again, quick and dirty).

As you can see above, there is a lot of talk between the PaaS. Let’s tackle that before we get into human access. PaaS communication almost exclusively happens through the Microsoft public backbone (some services have special features as I’ll talk about in a minute). This means control of that inbound traffic is going to be done through the PaaS service firewall and trusted Azure service exception for Azure OpenAI / AI Foundry, AI Search, and Azure Storage (optionally using resource exception for storage). If you’re using the AI Search Standard or above SKU you get access to the Shared Private Access feature which allows you to inject a managed Private Endpoint (this is a Private Endpoint that gets provisioned into a Microsoft-managed virtual network allowing connectivity to a resource in your subscription) into a Microsoft-managed virtual network where AI Search compute runs giving it the ability to reach the resource using a Private Endpoint. While cool, this is more cost and complexity.
Outbound access controls are limited in this pattern. There are some data exfiltration controls that can be used for Azure OpenAI / AI Foundry which are inherited from the Cognitive Services framework which I describe in detail in this post. AI Search and Azure Storage don’t provide any native outbound network controls that I’m aware of. This lack of outbound network controls was a sore point for customers in these patterns.
For inbound network flows from human actors (or potentially non-human if there is an app between the consumer and the Azure OpenAI / AI Foundry service) you were limited to the service firewall’s IP whitelist feature. Typically, you would whitelist the IP addresses of forward web proxy in use by the company or another IP address where company traffic would egress to the Internet.

Did this work? Yeah it did, but oh boy, it was never simple to approved by organizational security teams. While IP whitelisting is pretty straightforward to explain to a new-to-Azure customer, the same can’t be said for the trusted services exception, shared private access, and resource exceptions. The lack of outbound network controls for AI Search and Storage went over like a lead balloon every single time. Lastly, the lack of consistent log schema and sometimes subpar network-based logging (I’m looking at you AI Search) and complete lack of outbound network traffic logs made the conversations even more difficult.
Could NSPs make this easier? Most definitely!
RAG with NSPs
NSPs remove every single one of the pain points described above. With an NSP you get:
- One tool for controlling both inbound and outbound network controls (kinda)
- Standardized log schema for network flows
- Logging of outbound network calls
We go from the mess above to the much more simple design pictured below.

In this new design we create a Network Security Perimeter with a single profile. In this profile there is an access rule which allows customer egress IP addresses for human users or non-human (in case users interact with an app which interacts with LLM). Each resource is associated to that profile within the NSP which allows non-human traffic between PaaS services since it’s all within the same NSP. No additional rules are required which prevents the PaaS services from accepting or initiating any network flows outside of what the access rules and communication with each other within the NSP.
In this design you control your inbound IP access with a single access rule and you get a standard manner to manage outbound access. No more worries about whether the product group baked in an outbound network control, every service in the NSP gets one. Logging? Hell yeah we got your logging for both inbound and outbound in a standard schema.
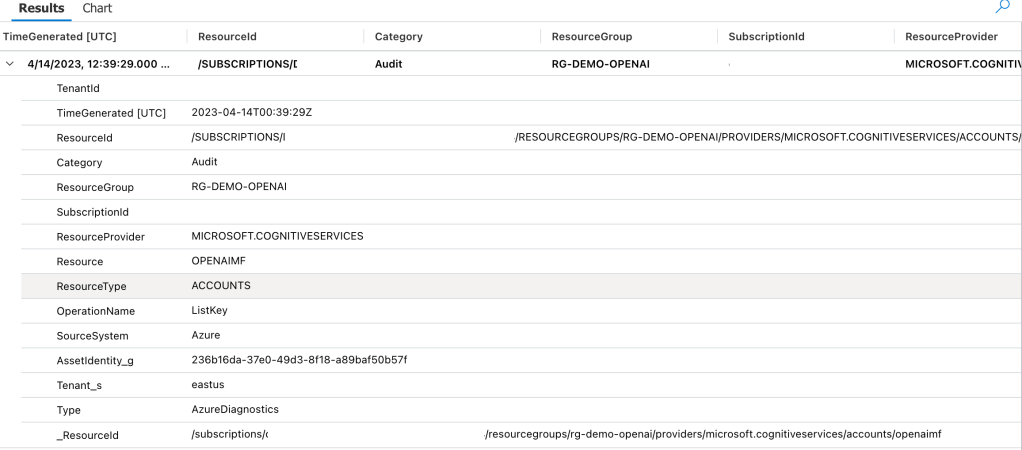
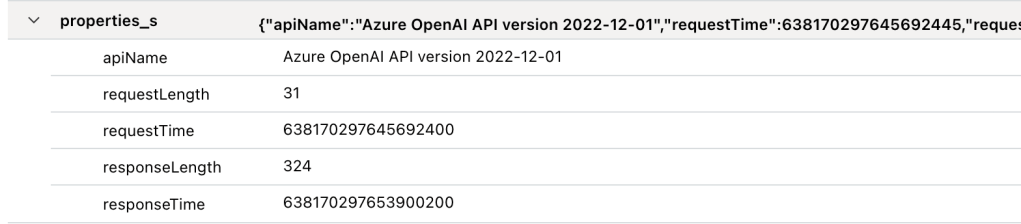
Once it’s setup you get you can monitor both inbound and outbound network calls using the NSPAccessLogs. It’s a great way to understand under the hood how these patterns work because the NSP logs surface the source resource, destination resource, and the operation being performed as seen below.

One thing to note, at least in East US 2 where I did my testing, outbound calls that are actually allowed since all resources are within the NSP falsley record as hitting the DenyAll rule. Looking back at my notes, this has been an issue since back in March 2025 so maybe that’s just the way it records or the issue hasn’t yet been remediated.
The other thing to note is when I initially set this all up I got an error in both AI Foundry’s chunking/loading method and AI Search’s. The error complains that an additional header of xms_az_nwperimid was passed and the consuming app wouldn’t allow it. Oddly enough, a second attempt didn’t hit the same error. If you run into this error, try again and open a support ticket so whatever feature on the backend is throwing that error can be cleaned up.
Summing it up
So yeah… NSPs make PaaS to PaaS flows like this way easier for all customers. It especially makes implementing basic network security controls far more simple for customers new to Azure that may not have a mature platform landing zone sitting around.
Here are your takeaways for today:
- NSPs give you standard inbound/outbound network controls for PaaS and standardized log schema.
- NSPs are especially beneficial to new customers who need to execute quickly with basic network security controls.
- Take note as of the date of this blog Azure OpenAI Service support for NSPs in public preview. You will need to enable the preview flag on the subscription before you go mucking with it in a POC environment. Do not use it in production until it’s generally available. Instructions are in the link.
- I did basic testing for this post testing ingestion, searching, and submitting prompts that reference the extra data source property. Ensure you do your own more robust testing before you go counting on this working for every one of your scenarios.
- If you want to muck around with it yourself, you can use the code in this repo to deploy a similar lab as I’ve built above. Remember to enable the preview flag and wait a good day before attempting to deploy the code.
Well folks, that wraps up this post. In my final post on NSPs, I’ll cover a use case for NSPs to help assist with troubleshooting common connectivity issues.
Thanks!