Azure Networking – Inspecting traffic to Private Endpoints Revisited… Again. Maybe for the last time?

Update 11/4/2024 – Added limitations
Update 10/11/2024 – Updated with generally available announcement

Welcome back! Today I’m going to step back from the Generative AI world and talk about some good ole networking. Networking is one of those technical components of every solution that gets glossed over until the rubber hits the road and the application graduates to “production-worthy”. Sitting happily beside security, it’s the topic I’m most often asked to help out with at Microsoft. I’m going to share a new feature has gone generally available under the radar that is pretty damn cool, even if a bit confusing.

Organizations in the regulated space frequently have security controls where a simple 5-tuple-based firewall rule at OSI layer 4 won’t suffice and traffic inspection needs to occur to analyze layer 7. Take for an example a publicly facing web application deployed to Azure. These applications can be subject to traffic inspection at multiple layers like an edge security service (Akamai, CloudFlare, FrontDoor, etc) and again when the traffic enters the customer’s virtual through a security appliance (F5, Palo Alto, Application Gateway, Azure Firewall, etc). Most of the time you can get away with those two inspection points (edge security service and security appliance deployed into virtual network) for public traffic and one inspection point for private traffic (security appliance deployed into virtual network and umpteenth number of security appliances on-premises). However, that isn’t always the case.

Many customers I work with have robust inspection requirements that may require multiple inspection points within Azure. The two most common patterns where this pops up is when traffic first moves through an Application Gateway or APIM (API Management) instance. In these scenarios some customers want to funnel the traffic through an additional inspection point such as their third-party firewall for additional checks or a centralized choke point managed by information security (in the event Application Gateways / APIM have been democratized). When the backend is a traditional virtual machine or virtual network injected/integrated (think something like an App Service Environment v3) the routing is quite simple and looks like something like the below.

Traffic inspection with traditional virtual machine or VNet Injected/VNet integrated service

In the above image we slap a custom route table on the Application Gateway subnet, and add a user-defined route that says when contacting the subnet containing the frontend resources of the application, it needs to go the firewall first. To ensure the symmetry of return traffic, we put a route table on the frontend subnet with a user-defined route that says communication to the Application Gateway subnet needs to also go to the firewall. The routes in these two route tables are more specific than the system route for the virtual network and take precedence forcing both the incoming and return traffic to flow symmetrically through the firewall. Easy enough.

The routing when inspecting traffic to services which receive their inbound traffic via a Private Endpoint (such as an App Service running in a Premium App Services Plan, a Storage Account, a Key Vault, etc) that inspection gets more challenging. These challenges exist for both controlling the traffic to the Private Endpoint and controlling the return traffic.

When a Private Endpoint is provisioned in a virtual network, a new system route is injected into the route tables of each subnet in that virtual network AND any peered virtual networks. This route is a /32 for the IP address assigned to the network interface associated with the Private Endpoint as seen in the image below.

System route added by the creation of a Private Endpoint in a virtual network

Historically, to work around this you had to drop /32 routes everywhere to override those routes to push the incoming traffic to the Private Endpoints through an inspection point. This was a nightmare at scale as you can imagine. Back in August 2023, Microsoft introduced what they call Private Endpoint Network Policies, which is a property of a subnet that allows you to better manage this routing (in addition to optionally enforcing Network Security Groups on Private Endpoints) by allowing less specific routes to override the more specific Private Endpoint /32 routes. You set this property to Enabled (both this routing feature and network security group enforcement) or RouteTableEnabled (just this routing feature). This property is set on the subnet you place the Private Endpoints into. Yeah I know, confusing because that is not how routing is supposed to work (where less specific routes of the same length override more specific routes), but this is an SDN (software defined network) so they’ll do what they please and you’ll like it.

Private Endpoint route invalid because Private Endpoint Network Policy property set to RouteTableEnabled

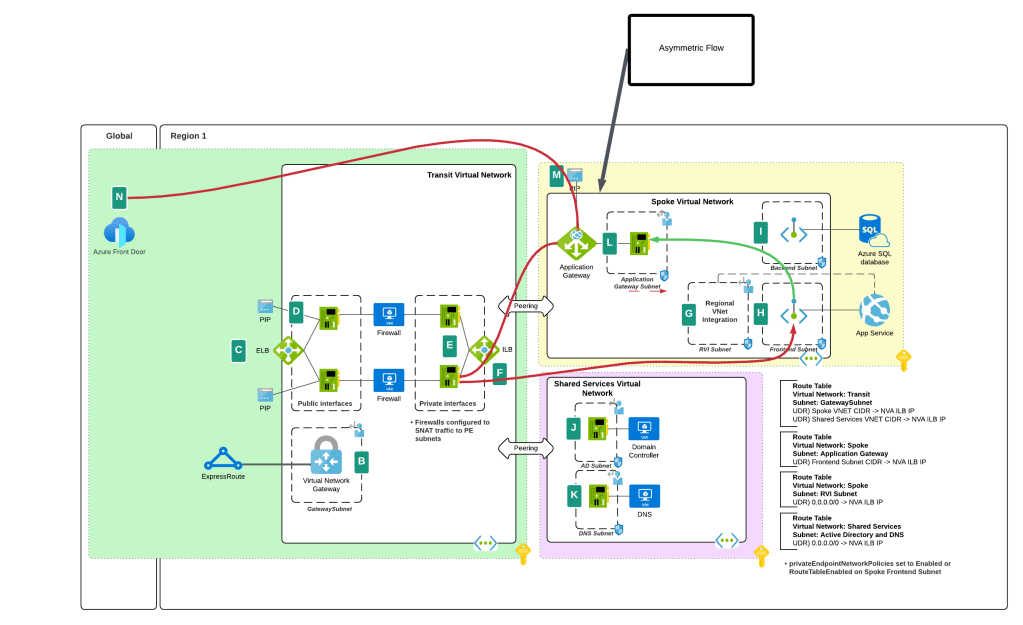
While this feature helped to address traffic to the Private Endpoint, handling the return traffic wasn’t so simple. Wrapping a custom route table around a subnet containing Private Endpoints does nothing to control return traffic from the Private Endpoints. They do not care about your user-defined routes and won’t honor them. This created an asymmetric traffic flow where incoming traffic was routed through the inspection point but return traffic bypassed it and went direct to the calling endpoint.

This misconfiguration was very common in customer environments and rarely was noticed because many TCP sessions with Private Endpoints are short lived and thus the calling client isn’t affected by the TCP RST sent by the firewall after X number of minutes. Customers could work around this by SNATing to the NVA’s (inspection point) IP address and ensure the return traffic was sent back to the NVA before it was passed back to the calling client. What made it more confusing was some services “just worked” because Microsoft was handling that symmetry in the data plane of the SDN. Azure Storage was an example of such a service. If you’re interested in understanding the old behavior, check out this post.

Prior asymmetric behavior without SNAT at NVA

You’ll notice I said “prior” behavior. Yes folks, SNATing when using a 3rd-party NVA (announcement is specific to 3rd-party NVAs. Those of you using Azure Firewall in a virtual network, Azure Firewall in a VWAN Secure Hub, or a 3rd-party NVA in a VWAN Secure Hub will need to continue to SNAT for now (As of 11/2024) until this feature is extended to those use case.

I bet you’re thinking “Oh cool, Microsoft is now having Private Endpoints honor user-defined routes in route tables”. Ha ha, that would make far too much sense! Instead Microsoft has chosen to require resource tags on the NICs of the NVAs to remove the SNAT requirement. Yeah, wouldn’t have been my choice either but here we are. Additionally, in my testing, I had it working without the resource tags to get a symmetric flow of traffic. My assumption (and total assumption as an unimportant person at Microsoft) is that this may be the default behavior on some of the newer SDN stacks while older SDN stacks may require the tags. Either way, do what the documentation says and put the tags in place.

As of today (10/11/2024) the generally available documentation is confusing as to what you need to do. I’ve provided some feedback to the author to fix some of the wording, but in the meantime let me explain what you need to do. You need to create a resource tag on either the NIC (non-VMSS) or VM instance (VMSS) that has a key of disableSnatOnPL with a value of true.

Magic of SDN ensuring symmetric flow without SNAT

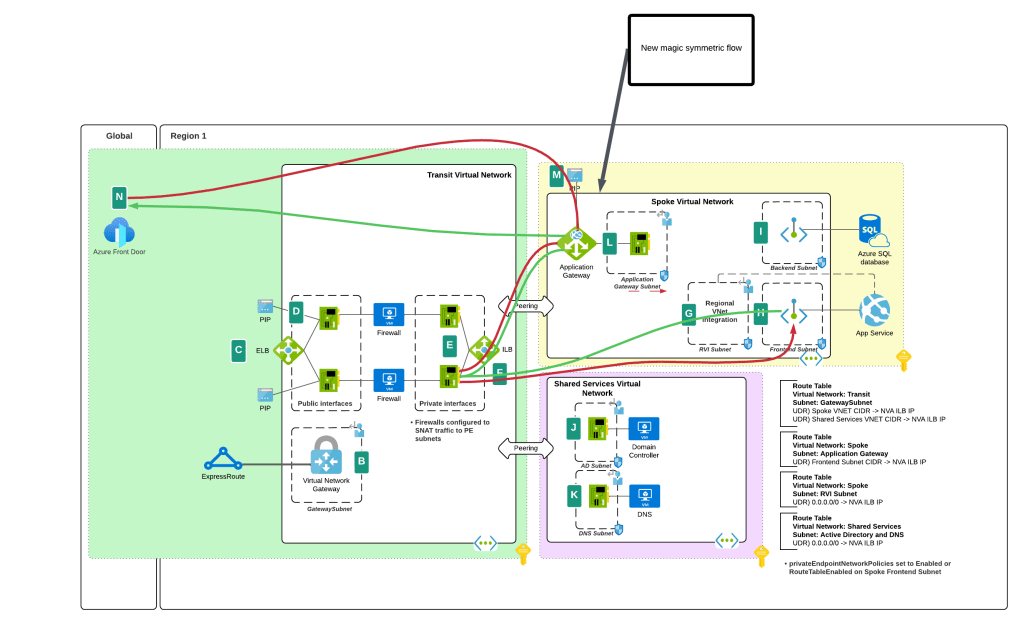
TLDR; SNAT should no longer be required to ensure symmetric traffic flow when placing an NVA between an endpoint and a Private Endpoint if you have the proper resource tag in place. My testing of the new feature was done in Central US and Canada Central with both Azure Key Vault and Azure SQL. I tested when the calling endpoint was within the same virtual network, when it was in a peered virtual network connected in a hub and spoke environment, and when the calling machine was on-premises calling a private endpoint in a spoke. In all scenarios the NVA showed a symmetric flow of traffic in a packet capture.

Azure OpenAI Service – Tracking Token Usage with APIM

This is part of my series on GenAI Services in Azure:

  1. Azure OpenAI Service – Infra and Security Stuff
  2. Azure OpenAI Service – Authentication
  3. Azure OpenAI Service – Authorization
  4. Azure OpenAI Service – Logging
  5. Azure OpenAI Service – Azure API Management and Entra ID
  6. Azure OpenAI Service – Granular Chargebacks
  7. Azure OpenAI Service – Load Balancing
  8. Azure OpenAI Service – Blocking API Key Access
  9. Azure OpenAI Service – Securing Azure OpenAI Studio
  10. Azure OpenAI Service – Challenge of Logging Streaming ChatCompletions
  11. Azure OpenAI Service – How To Get Insights By Collecting Logging Data
  12. Azure OpenAI Service – How To Handle Rate Limiting
  13. Azure OpenAI Service – Tracking Token Usage with APIM
  14. Azure AI Studio – Chat Playground and APIM
  15. Azure OpenAI Service – Streaming ChatCompletions and Token Consumption Tracking
  16. Azure OpenAI Service – Load Testing

Yeah, yeah, yeah, I missed posting in July. I have been appropriately shamed on a daily basis by WordPress reminders.

I’m going to make up for it today by covering another of the “Generative AI Gateway” features of APIM (Azure API Management) that were announced a few months back. I’ve already covered the circuit breaker and load balancing and the token-based rate limiting features. These two features have made it far easier to distribute and control the usage of the AOAI (Azure OpenAI Service) that is being offered as a core enterprise service. One of the challenges that isn’t addressed by those features is charge backs.

As I’ve covered in prior posts, you can get away with an instance or two of AOAI dedicated to an app when you have one or two applications at the POC (proof-of-concept) stage. Capacity and charge back isn’t an issue in that model. However, your volume of applications will grow as well as the capacity of tokens and requests those applications require as they move to production. This necessitates AOAI being offered as a core foundational service as basic as DNS or networking. The patterns for doing this involve centrally distributing requests across several instances of AOAI spread across different regions and subscriptions using a feature like the circuit breaker and load balancing features of APIM. Once you have several applications drawing from a common pool, you then need to control how much each of those applications can consume using a feature like the token-based rate limiting feature of APIM.

Common way to scale AOAI service

Wonderful! You’ve built a service that has significant capacity and can service your BUs from a central endpoint. Very cool, but how are you gonna determine who is consuming what volume?

You may think, “That information is returned in the response. I can have the developers use a common code snippet to send that information for each response to a central database where I can track it.” Yeah nah, that ain’t gonna work. First, you ain’t ever gonna get that level of consistency across your enterprise (if you do have this, drop me an email because I want to work there). Second, as of today, the APIs do not return the number of tokens used for streaming based chat completions which will be a large majority of what is being sent to the models.

I know you, and you’re determined. You follow-up with, “Well Matt, I’m simply going to pull the native metrics from each of the AOAI instances I’m load balancing to.” Well yeah, you could do that but guess what? Those only show you the total consumed across the instance and do not provide a dimension for you to determine how much of that total was related to a specific application.

Native metrics and its dimensions for an instance of AOAI

“Well Matt, I’m going to configure diagnostic logging for each of my AOAI instances and check off the Request and Response Logs. Surely that information will be in there!”. You don’t quit do you? Let me shatter your hopes yet again, no that will not work. As I’ve covered in a prior post while the logs do contain the Entra ID object ID (assuming you used Entra ID-based authentication) you won’t find any token counts in those logs either.

AOAI Request and Response Logs

Well fine then, you’re going to use a custom logging solution to capture token usage when it’s returned by the API and calculate it when it isn’t. While yes this does work and does provide a number of additional benefits beyond information for charge backs (and I’m a fan of this pattern) it takes some custom code development and some APIM policy snippet expertise. What if there was an easier way?

That is where the token metrics feature of APIM really shines. This feature allows you to configure APIM to emit a custom metric for the tokens consumed by a Completion, Chat Completion (EVEN STREAMING!!), or Embeddings API call to an AOAI backend with a very basic APIM Policy snippet. You can even add custom dimensions and that is where this feature gets really powerful.

The first step in setting this up is to spin up an instance of Application Insights (if your APIM isn’t already hooked into one) and a Log Analytics Workspace the Application Insights instance will be associated with. Once your App Insights instance is created, you need to modify the settings API in APIM you’ve defined for AOAI and turn on the App Insights integration and enable custom metrics as seen below.

Enable custom metrics in APIM

Next up, you need to modify your APIM policy. In the APIM Policy snippet below I extra a few pieces of data from the request and add them as dimensions to the custom metric. Here I’m extracting the Entra ID app id of security principal accessing the AOAI service (this would be the application’s identity if you’re using Entra ID authentication to the AOAI service) and the model deployment name being called from AOAI which I’ve standardized to be the same as the model name.

         <!-- Extract the application id from the Entra ID access token -->

        <set-variable name="appId" value="@(context.Request.Headers.GetValueOrDefault("Authorization",string.Empty).Split(' ').Last().AsJwt().Claims.GetValueOrDefault("appid", string.Empty))" />

        <!-- Extract the model name from the URL -->

        <set-variable name="uriPath" value="@(context.Request.OriginalUrl.Path)" />
        <set-variable name="deploymentName" value="@(System.Text.RegularExpressions.Regex.Match((string)context.Variables["uriPath"], "/deployments/([^/]+)").Groups[1].Value)" />

        <!-- Emit token metrics to Application Insights -->

        <azure-openai-emit-token-metric namespace="openai-metrics">
            <dimension name="model" value="@(context.Variables.GetValueOrDefault<string>("deploymentName","None"))" />
            <dimension name="client_ip" value="@(context.Request.IpAddress)" />
            <dimension name="appId" value="@(context.Variables.GetValueOrDefault<string>("appId","00000000-0000-0000-0000-000000000000"))" />
        </azure-openai-emit-token-metric>

After making a few calls from my code to APIM, the metrics begin to populate in the App Insights instance. To view those metrics you’ll want to go into the App Insights blade and go to the Monitoring -> Metrics section. Under the Metrics Namespace drop down you’ll see the namespace you’ve created in the policy snippet. I named mine openai-metrics.

Accessing custom metrics in App Insights for token metrics

I can now select metrics based on prompt tokens, completion tokens, and total tokens consumed. Here I select the completion tokens and split the data by the appId, client IP address, and model to give me a view of how many tokens each app is consuming and of which model at any given time span.

Metrics split by dimensions

Very cool right?

As of today, there are some key limitations to be aware of:

  1. Only Chat Completions, Completions, and Embedding API operations are supported today.
  2. Each API operation is further limited by which models it supports. For example, as of August 2024, Chat Completions only supports gpt-3.5 and gpt-4. No 4o support yet unfortunately.
  3. If you’re using a load balanced pool backend, you can’t yet use the actual backend the pool send the request to as a dimension.

Well folks, hopefully this helps you better understand why this functionality was added and the value it provides. While you could do this with another API Gateway (pick your favorite), it likely won’t be as simple as it it with APIM’s policy snippet. Another win for cloud native I guess!

Thanks!